This project has been archived, no longer grabbing live images from various sources for personal web hosting performance reasons. It now sits in the toolbox for future space endeavors when needed. My CEO dropped off a magazine before the holiday break with an article about monitoring live solar weather. What started as something interesting to read sparked a very fascinating endeavor! As I've enjoyed combining webcam images and other data in the past used Live Devner image/weather, playing with live solar imagery took the excitement out of this world. I wrote a script to start automatically pulling in and archiving 32 live or nearly live solar images from Solar Dynamics Observatory (SDO), NOAA's Space Weather Protection Center (SWPC), Solar and Heliospheric Observatory (SOHO) and Solar TErrestrial RElations Observatory (STEREO). I also built a crude Flash interface (above) to load and play images being collected. The result: HOT.
Why monitor solar activity?
The sun is a giant violent ball of burning gas over 100 times bigger than Earth that spews out particles in all directions via solar flares or coronal mass ejections (CMEs). When the number and speed of those particles increase out of the norm at Earth, they can cause problems with our technology in space, communications, and could even cause powergrid blackouts on the ground. Monitoring and forecasting solar storms/weather can help us prevent issues by temporarily shutting down satellites or taking other steps to prevent unnecessary damage. As far as this blog post is concerned, the solar imagery produced by recently launched missions is absolutely stunning. Monitoring the live images of what we cannot stare at directly (don't stare at the sun, you'll go blind!) is fascinating. Below are some shared notes and basic info on what's out there producing live solar imagery made available to the general public.
Solar Dynamic Observatory (SDO)
Courtesy of NASA.
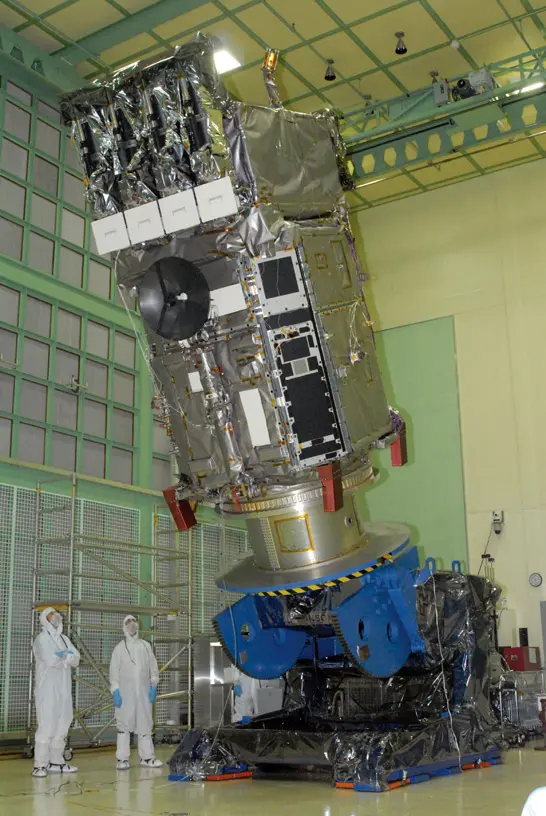
When I read "observatory", I think of a dome shaped building on a mountain top containing a big telescope. The Solar Dynamics Observatory (SDO) takes observatories to the next level as it's instead a satellite the size of a truck orbiting the Earth, containing multiple instruments. Launched February 11, 2010, SDO hosts three suites of instruments to peer at the sun with. The Atmospheric Imaging Assembly (AIA) takes images of the sun at various wavelengths. The Helioseismic and Magnetic Imager (HMI) captures magnetograms, intensitygrams, and doplergrams. SDO is also home of the Extreme ultraviolet Variability Experiment (EVE), hosting a pinhole X-ray imager, and other instruments that collect a wide range of in-depth data.
Original image courtesy of NASA/SDO and the AIA, EVE, and HMI science teams.
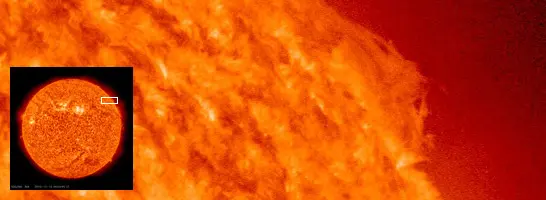
SDO's Atmospheric Imaging Assembly (AIA) takes very high resolution images of the sun, made available to the public in near real-time. Above is a sample at full resolution/304 wavelength.
Courtesy of NASA/SDO and the AIA, EVE, and HMI science teams.
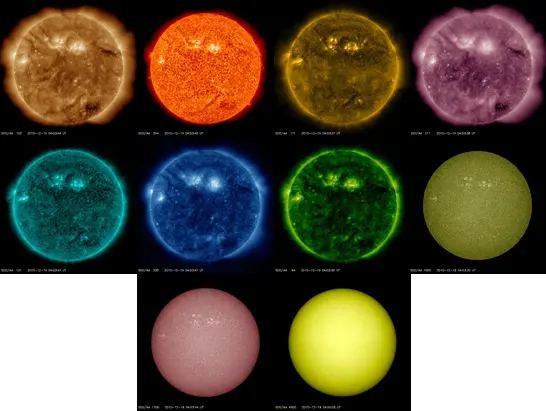
AIA uses a set of four telescopes to observe solar plasma over a wide range of temperatures. Wavelengths from left to right, top to bottom in the above image: AIA 193, AIA 304, AIA 171, AIA 211, AIA 131, AIA 335, AIA 094, AIA 1600, AIA 1700, AIA 4500
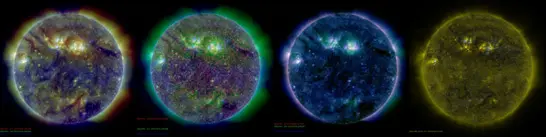
Courtesy of NASA/SDO and the AIA, EVE, and HMI science teams.
Composite images are also produced, combining multiple wavelengths (and HMI, far right image) for a fuller view.
Courtesy of NASA/SDO and the AIA, EVE, and HMI science teams.
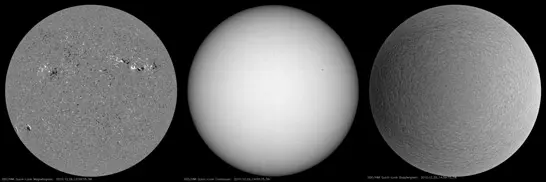
The Helioseismic and Magnetic Imager (HMI) on the SDO is a follow up to the Michelson Doppler Imager on the Solar and Heliospheric Observatory (SOHO, further down). HMI measures motion of the photosphere and also measures the magnetic field. HMI's observations will help establish relationships between the sun's internal dynamics and magnetic activity. HMI produces three unique types of solar images. From left to right above: HMI magnetogram, HMI intensitygram, HMI dopplergram
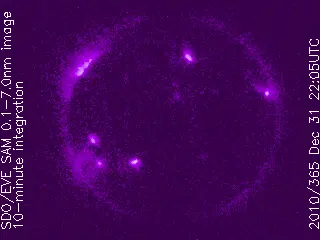
Courtesy of NASA/SDO and the AIA, EVE, and HMI science teams. HMI also sports a pinhole camera that takes Soft X-Ray images (above).
NOAA/NWC Space Weather Protection Center, GEOS-15 Satellite, and POES Satellites

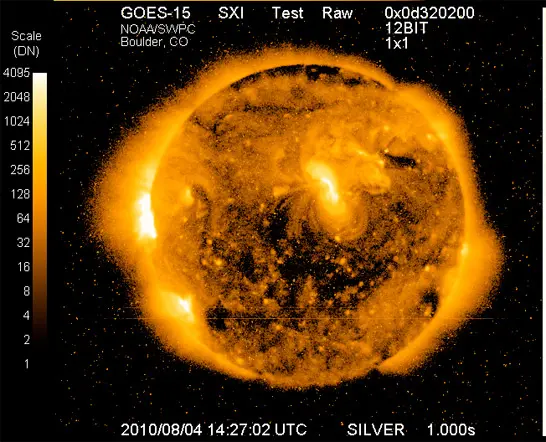
Courtesy of NASA. Launched March 4, 2010 from Cape Canaveral Air Force Station in Florida, the GEOS-15 satellite (formerly named GEOS-P), is one of a constellation of Geostationary Operational Environmental Satellites (GEOS) orbiting the Earth. GEOS satellite imagery is used to monitor storm development, estimate rainfall, snowfall accumulations and snow coverage. The satellites also monitor the movement of sea and lake ice, along with detecting ice fields among several other tasks.
Courtesy of the National Oceanic and Atmospheric Administration.
GEOS-15 in particular (along with its predecessors GEOS-13 and GEOS-14) additionally keeps an eye on solar activity and provides a Solar X-Ray Image (SXI) (above). The image is updated and made available to the public by the National Oceanic and Atmospheric Administration (NOAA) / National Weather Service (NWC) Space Weather Protection Center (SWPC).
[ ] -link archived-
Courtesy of the National Oceanic and Atmospheric Administration.
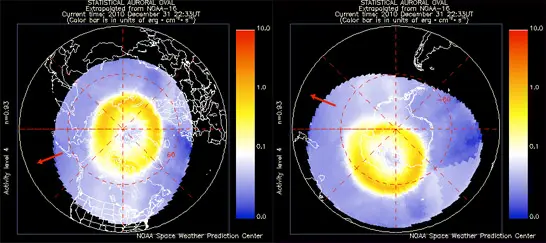
NOAA Polar-orbiting Operational Environmental Satellite (POES) system consists of two near polar-orbiting satellites that orbit Earth over 14 times per day. POES collects data for several land, ocean, and atmospheric applications. One application shown above is the monitoring of the power flux carried by the protons and electrons from the sun that produce aurora in the atmosphere. The SWPC is able to estimate the amount of power deposited in the polar regions using POES data, and plot it on a map with an "activity level" index of 1 to 10.
Solar and Heliospheric Observatory (SOHO)
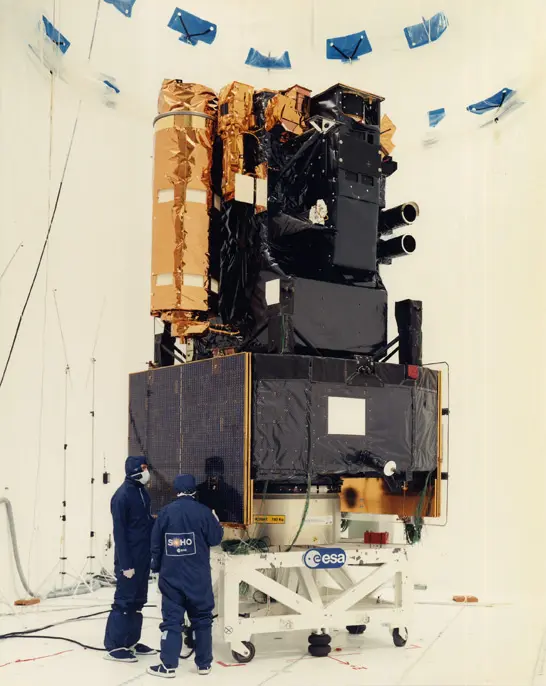
Courtesy of NASA.
A project of international collaboration between ESA and NASA, the Solar and Heliospheric Observatory (SOHO) was launched December 2, 1995. It was built to study the sun from the core, corona and the solar wind it sends out.
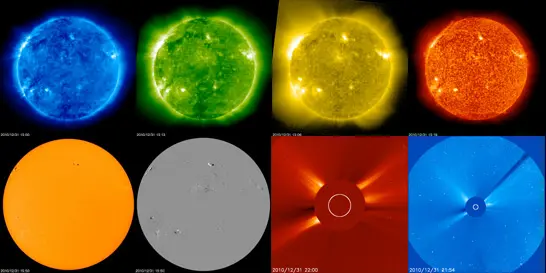
Courtesy of NASA.
After the launch of SDO, the frequency (cadence) of produced live images was reduced for SOHO's Extreme ultraviolet Imaging Telescope (EIT) (top row above) and Michelson Doppler Imager (MDI) (bottom row, left two) to about once or twice per day. The unique Large Angle and Spectrometric Coronagraph (LASCO) (bottom row, right two) images are still being produced once every 30 minutes or so and are used to observe solar wind (and 2,000 comet sightings since December 26th, 2010!).
Solar TErrestrial RElations Observatory (STEREO)
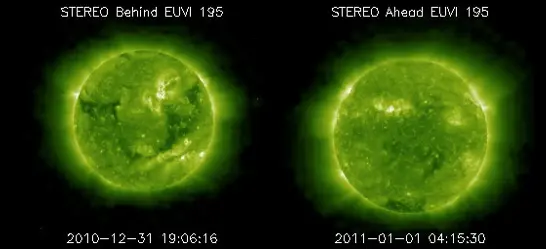
Courtesy of NASA.
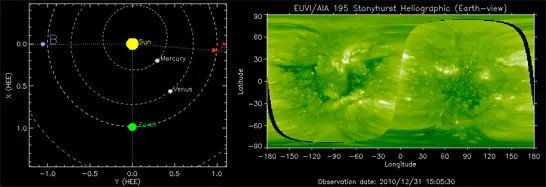
Solar TErrestrial RElations Observatory (STEREO) is a set of two nearly identical satellites, one that orbits the sun a quarter orbit ahead of Earth, and one that orbits a quarter orbit behind Earth. The positioning of the satellites allow a view of what's on the other side of the sun not visible to Earth. On an added note, the EUVI/AIA 195 Stonyhurst Heliographic on the bottom left (above) uses imagery/data from SDO to fill in the middle of the image. The black strip on the sides represent areas of the sun neither STEREO or SDO satellite can see.
What am I missing?
This was an information overload of fun, but I'm sure there's still more live imagery out there. If you know of a good reliable source, or see some information that's not quite right above, let me know! :)
Sources and Further Reading
Solar Dynamics Observatory (SDO) https://sdo.gsfc.nasa.gov/ SDO is GO https://sdoisgo.blogspot.com/ SDO's Atmospheric Imaging Assembly (AIA) https://aia.lmsal.com/ HMI Major Science Goals [https://hmi.stanford.edu/Description/hmi-overview/hmi-overview.html] -link archived- NOAA Watch: Space Weather [https://www.noaawatch.gov/themes/space.php] -link archived- NOAA Space Weather Protection Center https://www.swpc.noaa.gov/ GEOS Solar X-Ray Imager [https://www.swpc.noaa.gov/sxi/index.html] -link archived- GOES-15 Weather Satellite Captures Its First Image of Earth [https://www.noaanews.noaa.gov/stories2010/20100407_goes15.html] -link archived- Solar and Heliospheric Observatory (SOHO) https://sohowww.nascom.nasa.gov Guide to SDO Data Analysis https://www.lmsal.com/sdodocs/doc/.../index.html Helioviewer https://helioviewer.org/ SolarMonitor.org https://www.solarmonitor.org/ NICT Space Environment Information Service https://hirweb.nict.go.jp/ Real-time and Near-real-time Solar Image Sites [https://www.swpc.noaa.gov/solar_sites.html] -link archived- STEREO https://stereo.gsfc.nasa.gov/
Disclaimer: Views and statements contained in this personal blog do not express the views of the Space Foundation.
Posted: 2011-01-02